

Like everything else, bitcoin is valued by supply and demand. The price increases when there is more demand and decreases when there is less. But for something that is as nascent and volatile as bitcoin, it’s often very hard to predict the trend and find out if the price is going up or down.
There are, however, some tools that give us a proper indication of price trends before making any investment decisions.
A bitcoin price chart is a good place to start:
Bitcoin Price Chart
I am sure you have come across several different types of bitcoin charts. The most frequent one you might have come across is the very basic line chart.
Line Chart
A line chart is a simple plot of price against time. It gives a good indication of where the price of bitcoin was at any given time in the past.
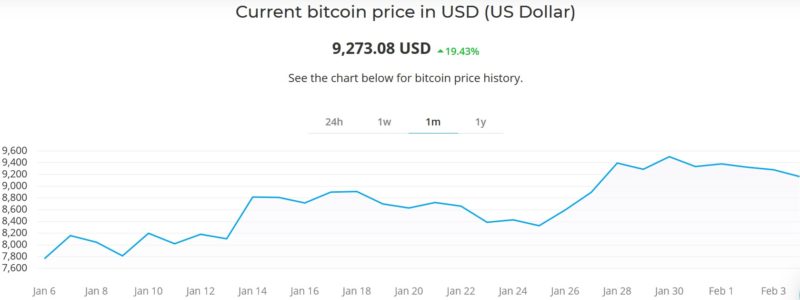
Above is a sample BTC price line chart from Paxful’s Bitcoin Calculator page. It shows the price of bitcoin across the last week of November. These charts have the price per bitcoin on the Y-axis and time on the X-axis. The closing prices are plotted to make the price line. The precision of this chart depends on how much we can fragment the time. But these types of charts can only give out so much information. It’s a great visual tool to get a brief overview of the prices, but many traders prefer to use more elaborate charts to make accurate investments and trading decisions.
Open-High-Low-Close (OHLC) charts
OHLC charts are typically used to illustrate movements in the price of a financial instrument over time. In other words, instead of showing one particular price at a certain time, OHLC charts show the change in prices over a unit of time. One of the styles of OHLC charts — candlestick charts — shows the change in prices in vertical lines on the chart.
Typically, traders prefer candlestick charts to make trading and investment decisions. The axes of this graph, like basic line charts, show price on the Y-axis and time on the X-axis. However, this graph is way more visual as each point on the price axis is represented by a candle.
Candlestick charts are marked by two distinct colors. Green candles represent bullish prices, such that that closing price per bitcoin is higher than the opening price; and red candles represent bearish prices, such that the closing price per bitcoin is lower than the opening price.
There are other forms of OHLC charts, such as the OHLC bar charts. They are pretty much the same in principle as candlestick charts, except instead of candlesticks, the opening and closing prices are represented by short horizontal lines of fixed length.
At first sight, OHLC bar charts can look complicated, but a skilled trader can spot a trend by looking at the candle’s spread to find out how much the price has gone up, down or sideways.
Though candlestick charts are much more common than bar charts, and the three most common candlestick styles that traders use are:
Doji
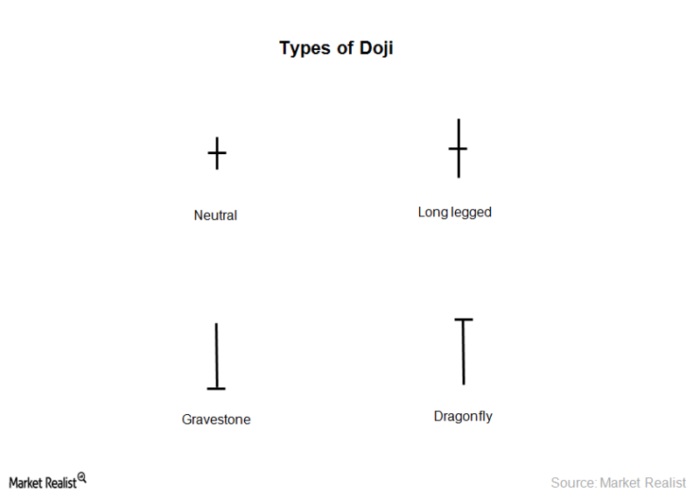
Doji is formed when the BTC price remains effectively the same during both the opening and closing of the time period. When viewed singly, Doji looks like a cross and shows a neutral change in prices, but some traders believe that the direction and spread of the change in prices between opening and closing of the time period can be analyzed to conclude a future bias.
Doji visually expresses the indecision between buyers and sellers. Doji essentially means that neither buyers nor sellers could take over the market and that something that may change the current trend is likely to happen.
Generally, a Doji after a bullish candle signifies that buying strains are starting to diminish and the trend may reverse to be advantageous for sellers. Vice versa, a Doji after a red means the opposite. However, bear in mind that a Doji alone is not sufficient to make any trading decisions — always look for further backing from other variables!
Hammer:
A candlestick is considered a hammer when the price sinks below the opening price only to recover later and close slightly above the opening price. Bulls — optimists who believe that the bitcoin price will go up — are often found betting on hammers as they believe that buyers are likely to begin crowding following an increasing demand for bitcoin.
Shooting Star:
A shooting star is the opposite of a hammer; it happens when the price starts to rally upwards only to close below the opening point at the end of the time period. It is often considered a bearish signal.
Watching these candlesticks might give you some semblance of future bias but to find a clearer picture, you may need to take historical data into account.
A tool that might help predict the future trend is through an analysis mechanism known as the Relative Strength Indicator (RSI).
Now, let’s define the following terms:
Overbought
During the price cycle of bitcoin, sometimes the price of bitcoin rises too high too fast, thus may start to look too expensive to investors. Soon, sellers may get a hold of the market and the bitcoin price may go down. This condition is termed overbought.
When bitcoin is overbought, it may simply mean that the price is going down.
Oversold
Oversold is the opposite of overbought. This happens when an asset is traded at a lower price than its worth and the price bounces back. Soon, investors may flock the market and may raise the price per bitcoin.
Now let’s get back to the relative strength index (RSI). RSI is a momentum indicator that measures the magnitude of bitcoin price changes to evaluate overbought or oversold conditions.
The RSI is displayed as an oscillator (a line graph that moves between two extremes) between 0 and 100. If the bitcoin’s RSI value is less than 30, it may be interpreted as oversold and if it is more than 70, it may be considered to be overbought. The RSI is then an interpretation of buy and sells signals in this fashion.


")
")